Short Diploma in Population and Demographic Studies
Short Diploma in Population and Demographic Studies is a free program on ARPS, the Arab Platform for Professional Studies. A practical foundation in population data: define who is counted and when, calculate structure and change, build a short conditional scenario, and turn a bounded finding into a reviewable service decision.
Important notice: Independent educational completion diploma; not a university degree, professional licence or endorsement by cited organizations.
Choose between a census, a population register and a survey for a defined question, then qualify coverage.
From lesson 1, readable now without an account: Population universe and reference date
Population universe and reference date
A population count answers a defined question: who, where and when? Before adding rows, specify the geographic boundary, reference date, unit of count (persons or households), and inclusion rule. One source might enumerate people present on a particular night while another uses usual residence. Different counts do not by themselves prove either source wrong. A visitor does not become a usual resident because they appear in a service register. Nor is a temporarily absent resident automatically excluded. The date forms were collected may differ from the reference date represented by responses. Collection over two weeks can still refer to one common day. Before calling a change between two years population growth, check whether boundaries, inclusion rules and dates match. A raw list may have more than one row for a person following an address transfer or data import. Do not delete a row solely because two names look alike; verify an identifier and record date. Keep a reconciliation table for each adjustment. Actual record linkage requires privacy controls. This invented case does not authorize release of individual information.
Before testing whether two sources agree, check each source's internal reconciliation. If age groups partition everyone exactly once, their sum should match the total for the same boundary and date. A gap may reflect unknown ages or different inclusion rules, not merely an addition error. Keep unknown ages separate rather than allocating them to groups by guesswork. If a register cannot distinguish visitors from usual residents, do not rescue the figure with an arbitrary correction factor. Label the measured population ‘people appearing in the register’ until a verifiable residence rule is available.
A free account saves your progress and takes you straight to lesson 1.
Program facts
Study fee
Free
subjects
6
lessons
27
Estimated time
80.5 hours
Content last reviewed
Access period
60 days
Study language
Arabic and English
About the program
Learn population sources, structure, movement and conditional projections. Five subjects connect evidence to a service decision; a separate practicum tests its operation and monitoring. Cases are invented, references support methods, and the diploma makes no claim to professional authorization.
Practical relevance
A reconciliation ledger, indicator card and scenario table can be applied to data a learner is authorized to use in an education or service organization. Lessons provide invented worked decisions while requiring privacy safeguards, edition checks and matched boundaries before applying methods to real records.
Why this program
Two population figures may look comparable while measuring different people, dates or boundaries. This program teaches a continuous workflow from source definition through indicator checks and aligned comparison to service demand scenarios. Each subject has its own summative assessment, and exercises identify conclusions that remain unverified.
Career relevance
Denominator, boundary and trend reading can assist people who research, plan or report service indicators. The content promises no job, promotion or authority to practice a regulated profession; real decisions require the responsible organization's data and mandate.
Career paths this program serves
This program is a step on the paths of the following occupations. Open a path to see its other programs in study order.
Define a population and reference date and choose between census, register and survey for a question.
Calculate age shares, dependency, household size and density while finding mismatched denominators.
Balance births, deaths and migration, and inspect incomplete registration and residuals.
Build a projection, test its sensitivity and review a saved projection against comparable observation.
Convert eligibility and conditional uptake into service demand and a reviewable recommendation.
Learning outcomes (5)
Define the counted population, observation date and evidence quality before calculating a rate.
Calculate composition indicators and interpret them without turning aggregate categories into claims about individuals.
Reconcile components of population change and use the right denominator and evidence for each process.
Construct transparent short horizon scenarios and avoid treating projection as a guaranteed forecast.
Combine demographic evidence, uncertainty and capacity constraints in an accountable service recommendation.
Who it is for
Learners and beginning researchers seeking structured population and demography knowledge beyond memorized indicator names. The content also serves planning and service staff who review resident counts, age groups and potential demand and must communicate limitations clearly.
People drafting a short evidence brief or contributing to resource discussions can use the method without advanced statistical modeling. No existing professional title is required, and completion does not authorize issuing official statistics on behalf of another organization.
Prerequisites
You should be willing to read tables of persons, households and dates and perform addition, subtraction, division and percentages with a basic calculator. Lessons introduce terms and denominators before formulas. University statistics courses and specialist software are not assumed.
An interest in a population or service question helps, together with a willingness to document assumptions and limits when sources differ. Every activity uses invented training values, so access to real personal records is neither needed nor requested.
What it does not offer
It is not a license to conduct official statistical practice or a professional endorsement.
It is not an external examination blueprint and cannot validate a local decision without local evidence.
Begin any population count by defining people, geographic boundary and reference date. Persons present may differ from usual residents, while raw rows differ from unique persons after checking duplicates, visitors and temporarily absent residents. Choose a census, register or survey for its question, coverage and date, not its label alone. Before a crude birth or death rate, align annual events with midyear persons on the same boundary and state the per-thousand unit. Distinguish field completion inside a register from coverage of all residents, and review disclosure risk in small cells. For two-date comparison, align boundaries, inclusion rules and estimate editions. If alignment is unavailable, state that the raw difference cannot be read directly as growth.
5 lessons · 12 hours
Population universe and reference date2 hours
Census, register and survey2 hours
Denominators and crude rates3 hours
Coverage, quality and privacy2 hours
Comparing two periods2 hours
Subject 2
Age, household and spatial structure
An age table needs nonoverlapping bands summing to people of known age, with unknowns visible separately. Each share requires an explicit denominator; pyramid shape alone does not prove births or migration. Age dependency puts ages 0–14 and 65+ over ages 15–64, but it does not count actual workers or economic dependants. Average household size uses members of included households over those households, not dwellings or group-quarter residents. Density divides residents by compatible land area; it does not measure travel or facility capacity. Finally, an association across districts is not evidence about every individual. Compare aligned eligible groups, test access and capacity explanations, and protect privacy before making an equity recommendation.
5 lessons · 11.5 hours
Age groups and pyramid2 hours
Dependency ratios and limits2 hours
Households and persons2 hours
Spatial distribution and density2 hours
Ecological inference and equity3 hours
Subject 3
Births, deaths and migration
Births and deaths are period events, while midyear population is the denominator of a crude per-thousand rate. Check event date, residence and duplicates; a hospital location is not necessarily the person's home. Crude rates describe whole populations and depend on age composition, so their difference is not an individual-risk verdict. Separate an end-date stock of people born elsewhere from entries and exits during a year; net migration conceals the two flow volumes. The population identity links start to births minus deaths plus entries minus exits. A gap from observed end is a residual for investigation, not proven hidden migration. Incomplete event recording cannot be repaired by an arbitrary multiplier: report registered events, test possible omissions separately and verify type, residence, period and duplication before correction.
5 lessons · 11.5 hours
Births and crude birth rate2 hours
Deaths and crude death rate2 hours
In and out migration3 hours
Population balancing equation2 hours
Incomplete event registration2 hours
Subject 4
Estimation, projection and uncertainty
Choose a baseline with known boundary, definition and edition, and flag series breaks before extracting a trend. Arithmetic growth assumes a constant absolute addition, while compound growth assumes a repeating percentage; both are conditional scenarios. In a component projection, label the population base observed and future births, deaths and migration separately assumed. Vary a named input in a sensitivity table and identify when results cross a decision threshold. Do not call an assumption range a confidence interval without a probabilistic method. When later data arrive, compare the saved projection with an observation on compatible boundaries and compute observed minus projected. Check source revisions, measurement and components before blaming the growth formula, and preserve the earlier version for learning.
5 lessons · 13 hours
Base year and series cleaning2 hours
Arithmetic and compound growth3 hours
Simple component projection1.5 hours
Sensitivity and ranges2 hours
Projection back check3 hours
Subject 5
Population evidence for service decisions
A resident is not automatically a service user. Estimate eligibility from a defined population, then apply conditional uptake among eligible persons for a compatible period. Keep unique users distinct from visits. Compare areas through eligible counts, use rates and capacity, without assigning a cause or proving inequity from one gap alone. When choosing longer hours or a mobile service, consider reach, capacity, cost and uncertainty, not only the aggregate number. A brief should preserve source, denominator, unit, date and inference limits in both languages. In an integrated file, classify each input as observed or assumed, then move from projection to eligibility, uptake and capacity. If changed uptake crosses the capacity threshold, revise the conditional recommendation and specify monitoring before permanent commitment.
5 lessons · 17.5 hours
From population to service demand3 hours
Fair area comparison3 hours
Choosing an intervention under constraints3 hours
Reporting without false certainty3 hours
Integrated decision file3 hours
Subject 6
Population decision and service delivery practicum
Apply diploma methods in a quarterly operating file, test room, funding and timing constraints, then hand over a documented decision.
2 lessons · 15 hours
Testing a community learning-centre operating plan10.5 hours
Monitoring delivery and closing the register gap3.5 hours
Subjects unlock in sequence as you progress.
Strengths
A connected skill sequence from population definition to a service decision file.
Invented numeric cases worked through, with exercises that have observable outputs and checking criteria.
Consistent separation of observation from assumption and area associations from individual claims.
Five subjects with an independent summative assessment per subject and a subject result record.
Evidence basis
Census, vital-event, indicator and projection methods draw on identified releases from United Nations bodies, the World Bank and WHO, alongside an independent source on ecological inference. Each reference is used only for supported claims. Numeric cases are invented teaching inputs, not real local statistics.
Reference organizations
United Nations Statistics Division
UN DESA Population Division
World Bank
World Health Organization
US Centers for Disease Control and Prevention
Methodology
Definitions are explained in worked invented cases and checked through exercises in each subject. Author review is self review, not endorsement or psychometric learner testing.
How the route works
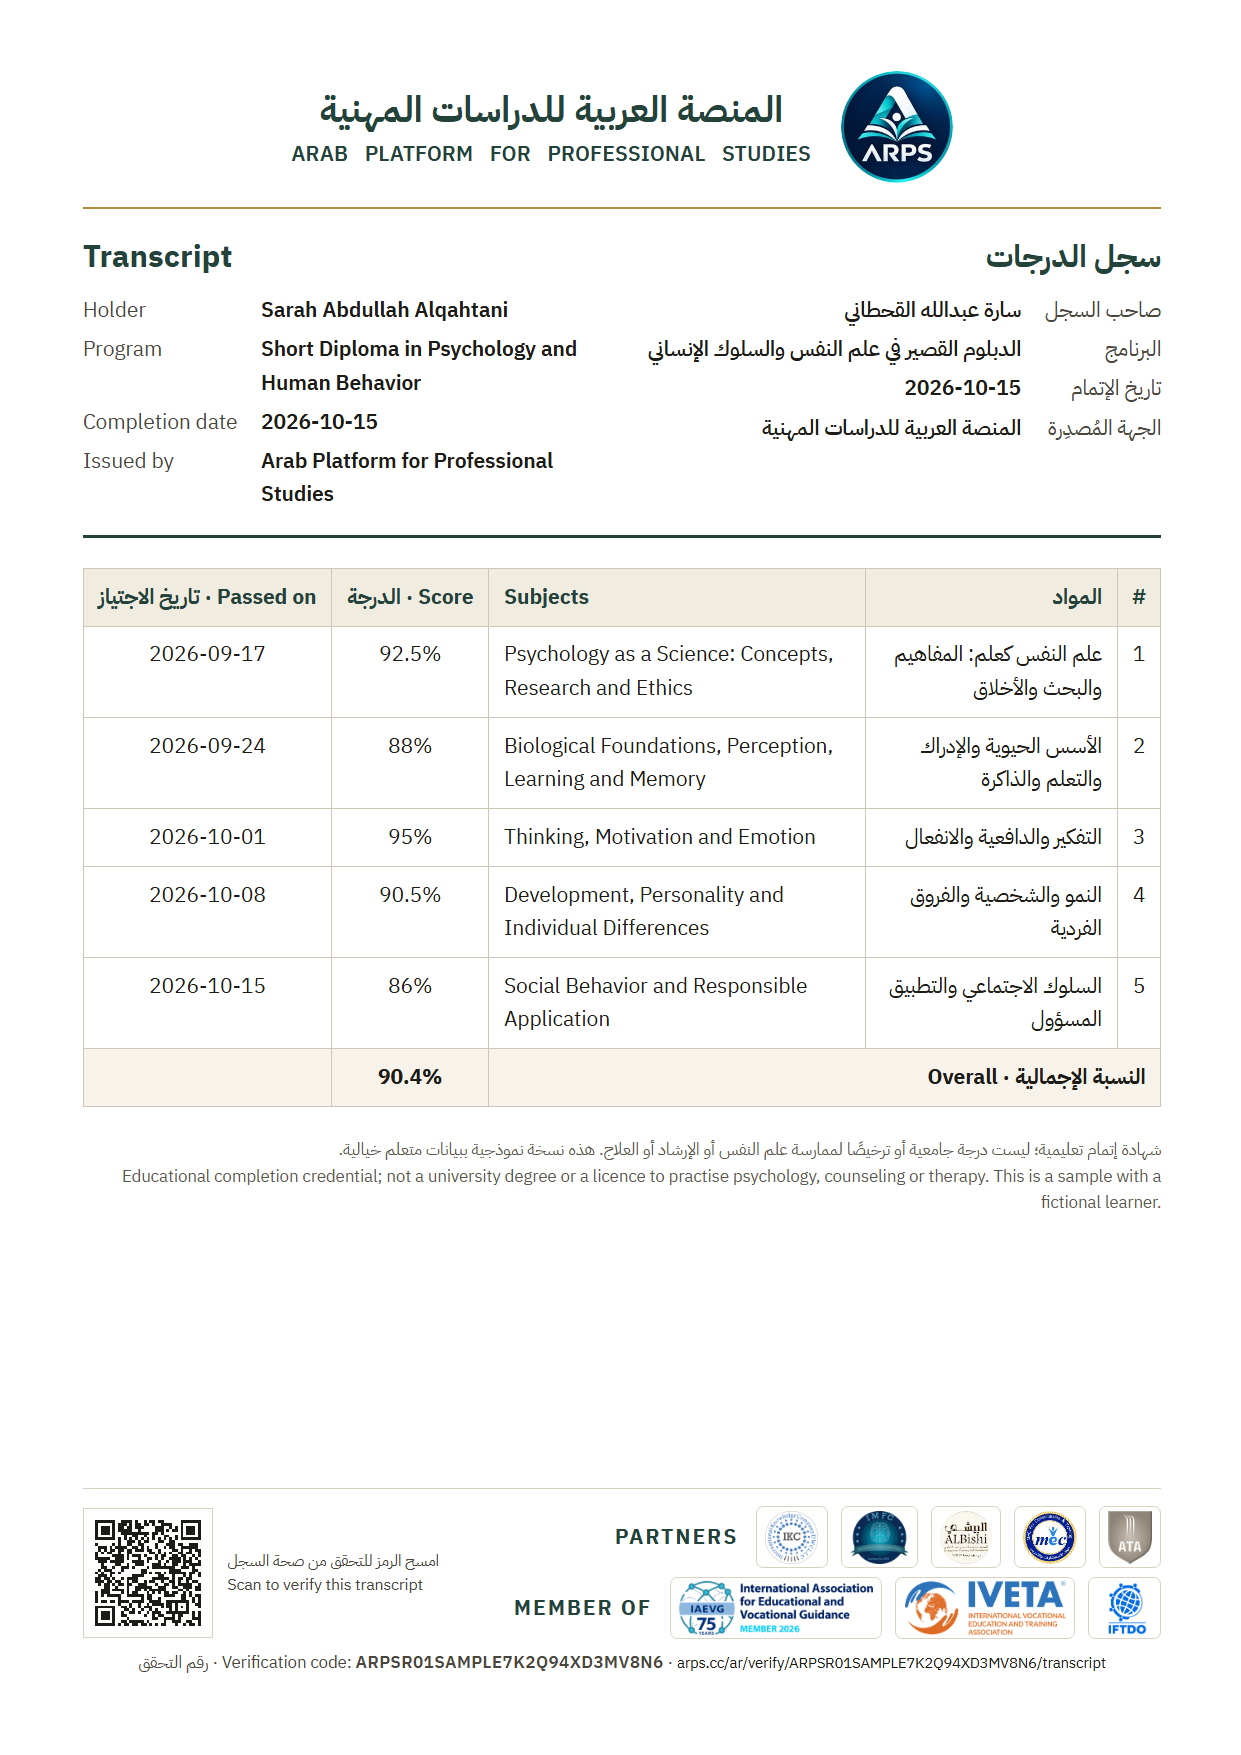
Short Diplomas are relatively comprehensive learning pathways that cover a major subject through five connected learning subjects and structured assessments, with a diploma transcript available with the credential.
Self-paced sequential study. Content unlocks progressively and each subject combines reading, examples, exercises, knowledge checks, and assessment.
Build integrated knowledge in a major subject.
Study through five clear, connected learning subjects.
Complete a defined assessment for each subject.
Receive a diploma transcript showing subjects and results when the credential is issued.
Assessment
Each Short Diploma contains five subjects, each with an approved assessment. A sixth final exam is not required when the five assessments adequately cover the learning outcomes.
Assessment attempts: 2 per assessment, 7 days apart
The pass mark is announced before the program is published.
Certificate
Successful completion makes the learner eligible for the Short Diploma certificate and Diploma Transcript under the credential policy.
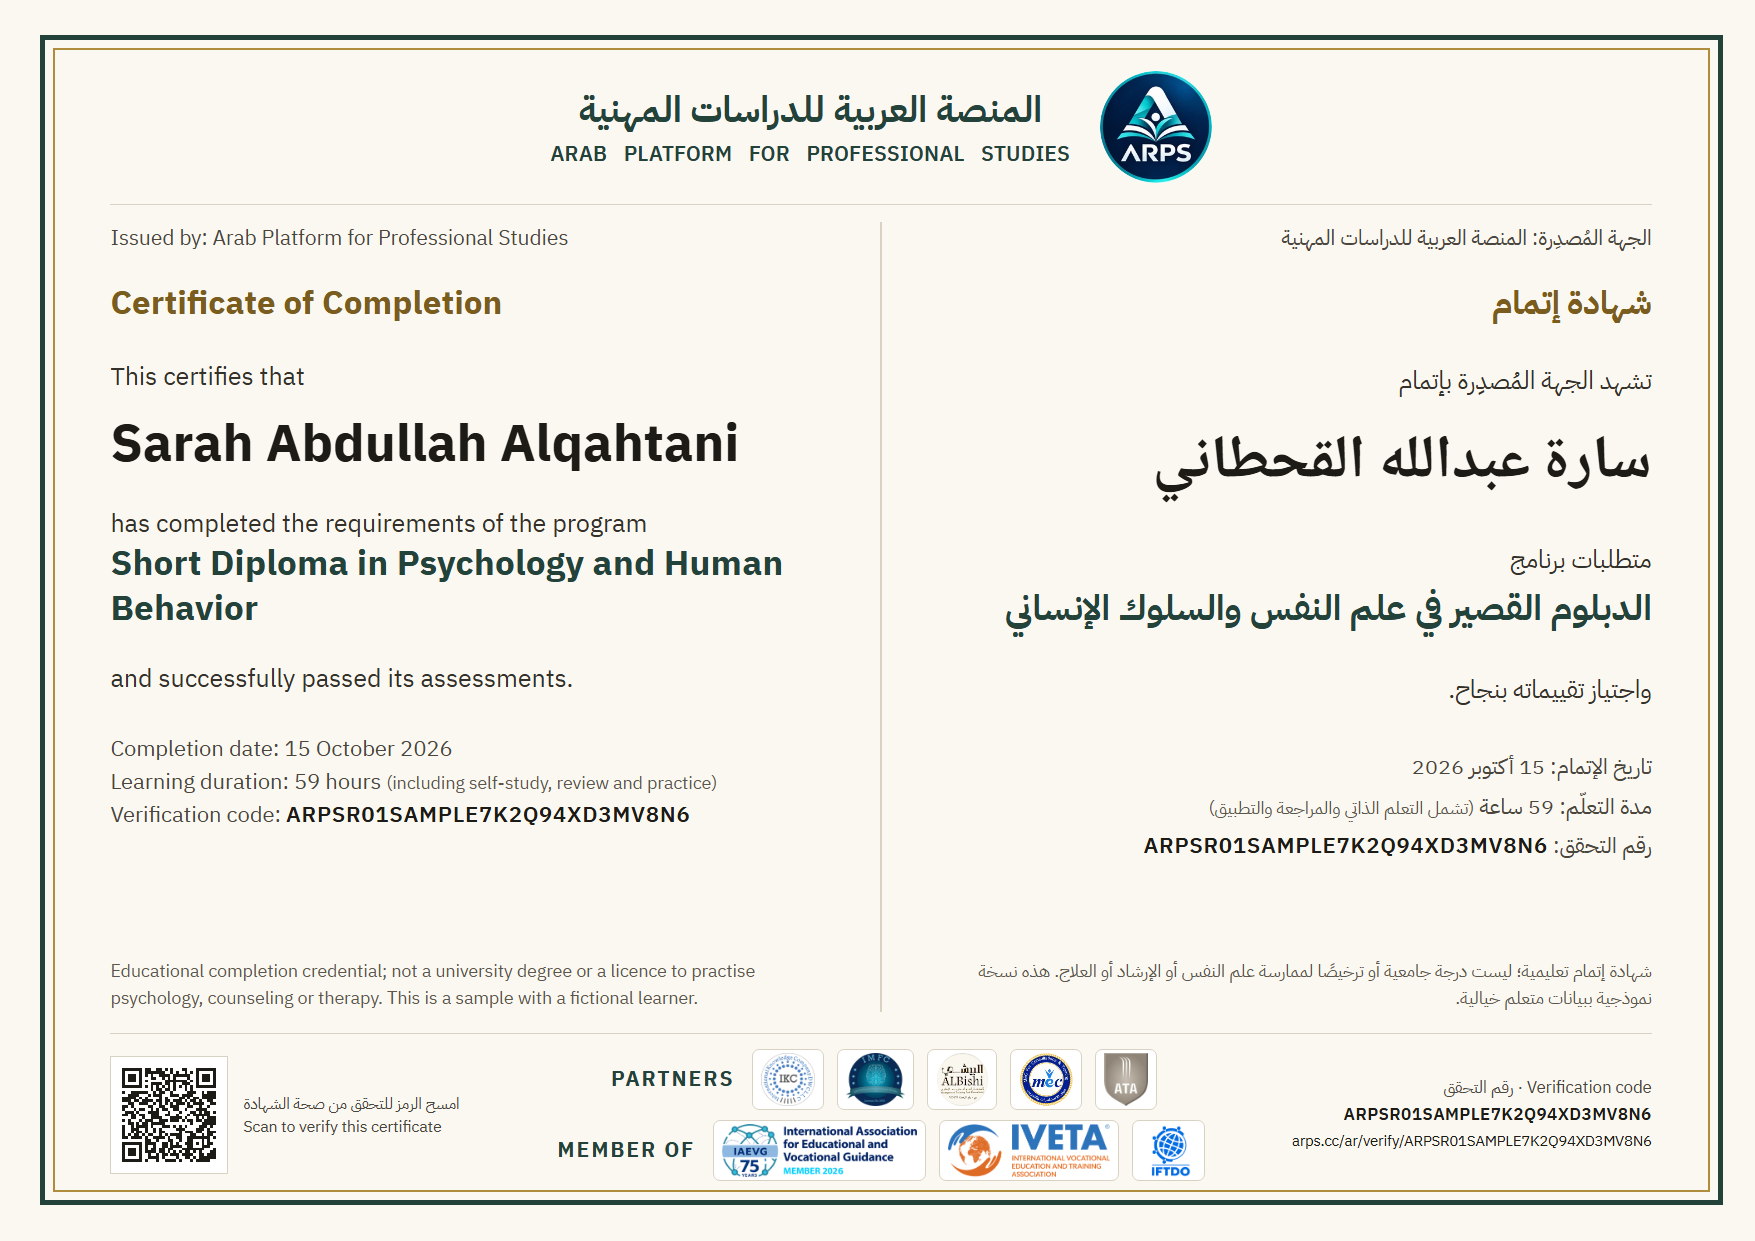
A sample from a real program in this track: Short Diploma in Psychology and Human Behavior. The learner, scores and dates are fictional; opens in a new window.
Disclaimer: Training completion, not a university degree or professional licence.
Program questions
Do I need prior statistics training?
Basic arithmetic, percentages and table reading are sufficient. Lessons define denominators and units and work through a case before independent practice.
Do the example values describe the named cities?
No. City names provide geographic context only; every regional example and its numbers are explicitly hypothetical.
Does completion grant a license or university degree?
No. This is an educational completion diploma, without professional authorization or a university degree.
How is learning assessed?
Each subject has its own summative assessment, preceded by checks and solved exercises. Central route policy controls attempts and result recording.
Can a service exercise be used for a real decision?
The method can be used with authorized real data after checking definitions, coverage, capacity, privacy and organizational decision authority. Training numbers must be replaced.
Show all (7)
Is Short Diploma in Population and Demographic Studies free, and do I get a certificate?
Yes. Short Diploma in Population and Demographic Studies is free on ARPS: every lesson, exercise and assessment is free, the first subject is open to read without an account, and the program is available in Arabic and English. Issuing a certificate is optional and has a published fee; it is a training completion certificate showing you passed the program's assessments, recognised by most private-sector organisations in the Gulf states and most Arab countries, and it strengthens your CV; confirming that a specific organisation accepts it remains your responsibility.
What other names is Short Diploma in Population and Demographic Studies known by?
The subject of this program is also known as: demography, population studies, demographic analysis. Learners usually find it by searching for: population studies course, demography short course, demographic analysis training, free demography course.
An applied introduction to disability and inclusion studies across rights, access, education, work and participatory inquiry. Learners identify barriers in a service journey, compare responses and test outcomes without reducing a person to a diagnosis.
Learn to diagnose social protection gaps, weigh evidence and alternatives, and write conditional, implementable recommendations within an advisory role.
This short diploma connects market-research design with consumer-behavior interpretation and evidence-bounded decisions. Six subjects progress from the research question through sampling, measurement, analysis, choice journeys, testing, and recommendation, ending with an applied market-research capstone.
6 subjects
24 lessons
62.5 hours
Free
Next step: a professional certification or a mini-master
Programs in the same domain that prepare you for an international certification exam or form a professional mini-master, also free.